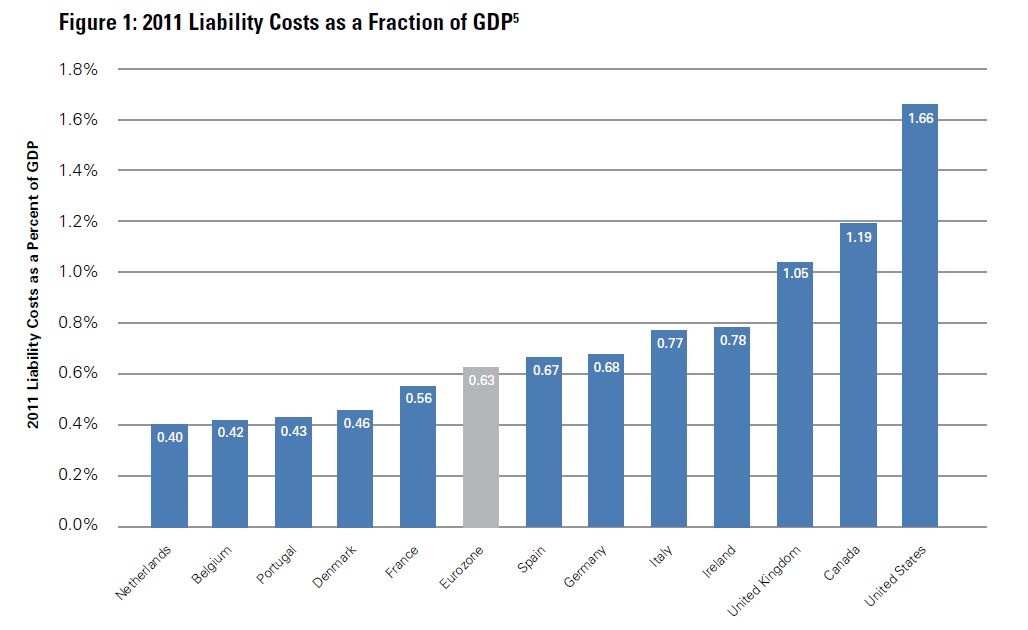
The U.S. Chamber of Commerce’s Institute for Legal Reform has come out with a study that compares litigation costs in the United States, Canada, Japan, and Europe. Not surprisingly, the U.S. have the highest litigation costs, measured as a percentage of GDP. Perhaps less expected: Within Europe, Germany has amongst the hightest growth rates of liability costs.
The Institute describes the design of the study as follows:
“The purpose of this study is to compare liability costs – a phrase used here to describe the costs of claims, whether resolved through litigation or other claims resolution processes – as a fraction of GDP across Europe, the U.S. and Canada. General liability insurance sold to companies provides a basis for comparison because it covers similar types of liability costs in each country. We separate out any cost differences due to the mix of business, spending on government social programs, and private health care costs in each country. By controlling for non-litigation-related factors, we have developed internationally comparable estimates of liability costs that reveal how much more expensive the most costly countries’ legal environments are than the rest.”
These were the key findings of the study:
-
The U.S. has the highest liability costs as a percentage of GDP of the countries surveyed, with liability costs at 2.6 times the average level of the Eurozone economies.
-
U.S. liability costs are four times higher than those of the least costly European countries in our study – Belgium, the Netherlands and Portugal.
-
Although the U.S. has by far the most costly liability system, the analysis shows that liability costs in the U.K., Germany and Denmark have risen between 13% and 25% per year since 2008.
I found this chart very informative, which summarized the estimates that were derived from the econometric analysis briefly described above (and more fully in an appendix to the study):
The comparative analysis for Japan was performed later, and is not included in the Chart. However, Japanese liability costs as a percent of GDP were lower than all of the other countries shown above.

